I became a part of an extreme hardware project for the last 2 weeks, where we isolated ourselves from the life on earth. It was an exciting period to discover and negotiate on new concepts, while roles has become intertwined. I even found myself performing XP (Extreme Programming) practices, pairing with a developer or writing code by switching roles. I observed situations which will suit with project management practices and software development.
Debuggability
The First Observation was on debuggability; the ability to debug and inspect how things are working. In general, developing our features for required use cases were easy to do, so the project was an easy process for our experience. Until that moment…
At the last minute, we noticed that the sender’s or receiver’s timing performance was not okay for one of the critical use case. We were relying on BLE timing performance heavily on the project. So we needed to analyze and debug the parties. Both sides’ app logic layer technically reported a satisfying result, but the feature was not working as wanted by the use case. At that moment, we noticed that, we didn’t have a method to validate the Sender’s and Receiver’s other layers of software. We needed a 3rd party with an unbiased observation; a debugger or a BLE sniffer in our case.
We have had some suspicions about sender’s operating system; iOS. Because we knew and tested the intention of Receiver and Sender’s logic part. The only remaining suspicion was on Sender’s OS. But without sniffing, nobody can develop a solution.
Unless we face up with undesired results, we don’t guess we’ll need debuggers, inspectors. After this experience, I’ll aim to put a budget for inspector equipment in the early stages of the later projects; even in this case, our sniffer cost will be less than 50 USD; which is an immediate-approval type of budget. (I might share a detailed post later, when we complete our debugging and solve the problem.)
While thinking on this, I noticed that, we might share a common analogy with machines; we as people has our operating systems, which will organize our survival, reflexes and thoughts.
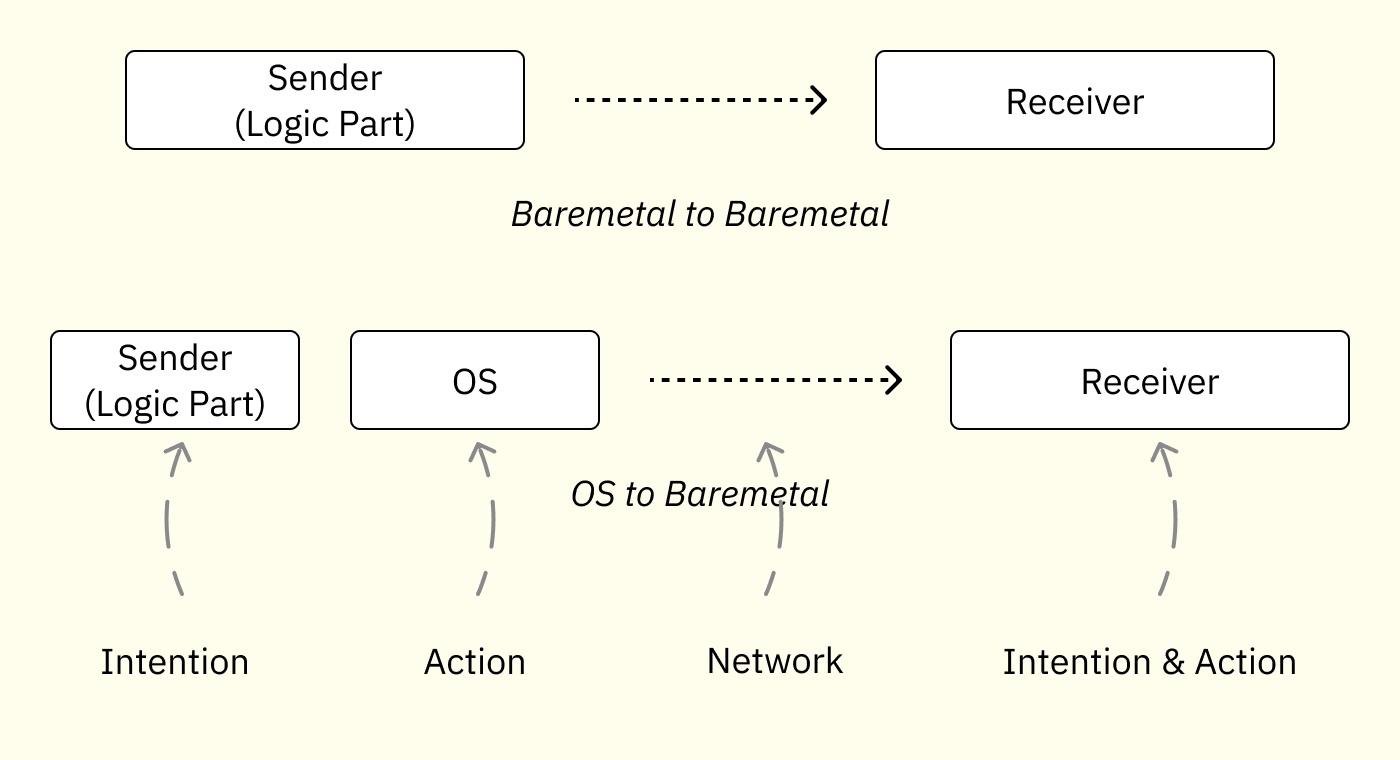
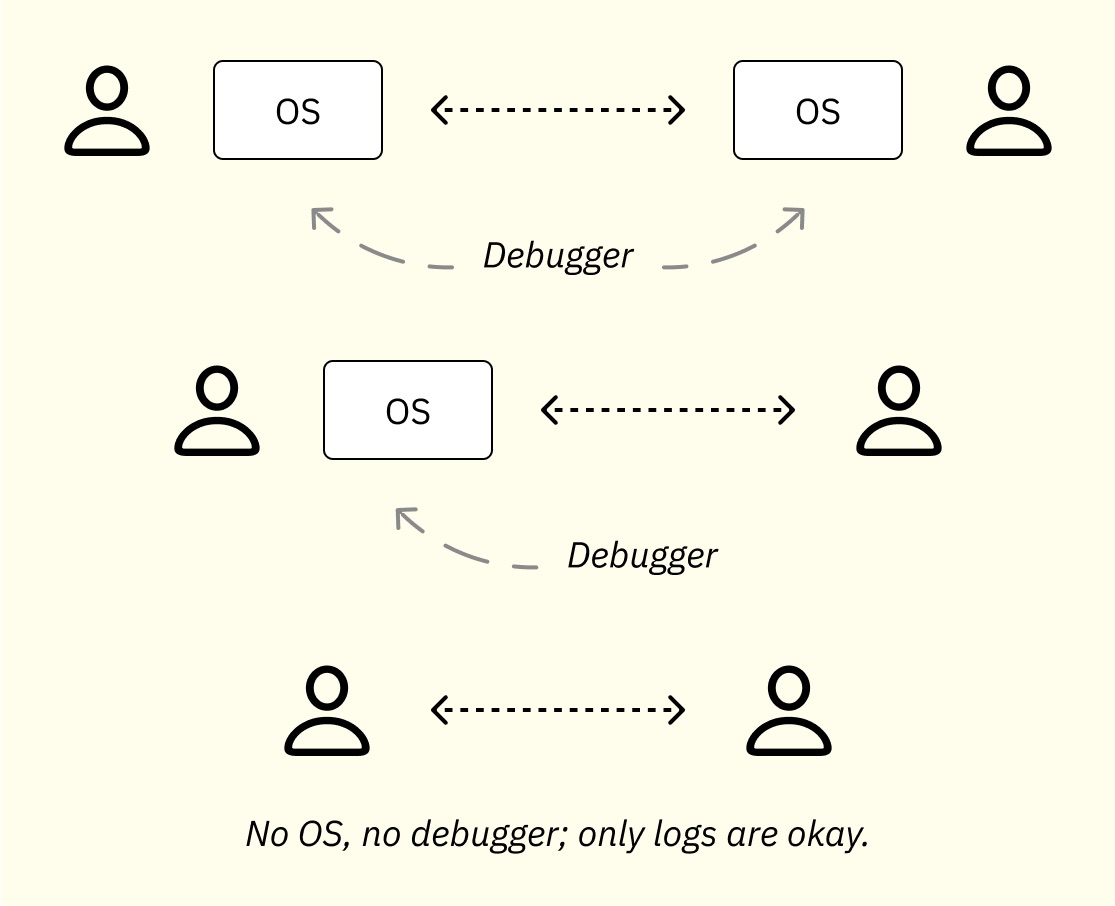
Case 1: Both parts (sender and receiver) are bare-metal systems; we can easily debug and keep logs, because there is no closed source operating systems which behaves like a proxy. This is good for two open and honest people; their OS won’t cause any proxy to their intentions.
Case 2: One part with OS and other part is bare-metal; we can check the intention (logic) of sender and receiver, then OS might need debug if it alters the intention. So this practically means checking the attitude of the person. The biggest portion of human-OS is attitude. In this case, a debugger / inspector might be useful. But even without it, we can develop a hypothesis.
Case 3: Both part has an OS. This is the difficult one; we can check the intentions, but two side has proxies; in this case we certainly need a debugger; observer.
Inventing New Diagrams
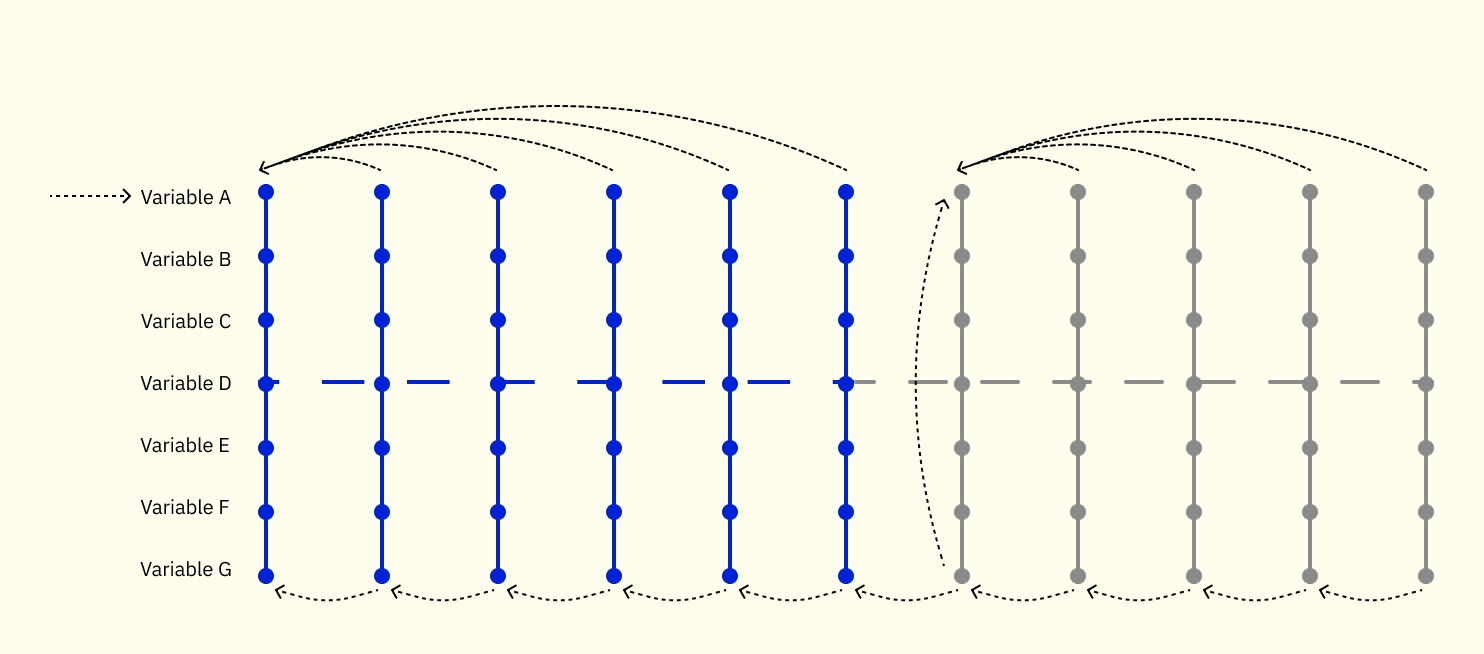
While discussing bare-metal systems, it’s natural to see engineers drawing boxes and writing some numbers on it. And it’s useful, too. But when we’re discussing on some scheduled task, the boxes were not helpful. It was like an example of 1-dimensional thinking, we were just able to imagine the consecutive flows like filling and consuming buffers. When our tasks include more variables and flags, we needed 2-dimensional architecture discussions, and we considered variables in the tasks as vertical nodes as below.
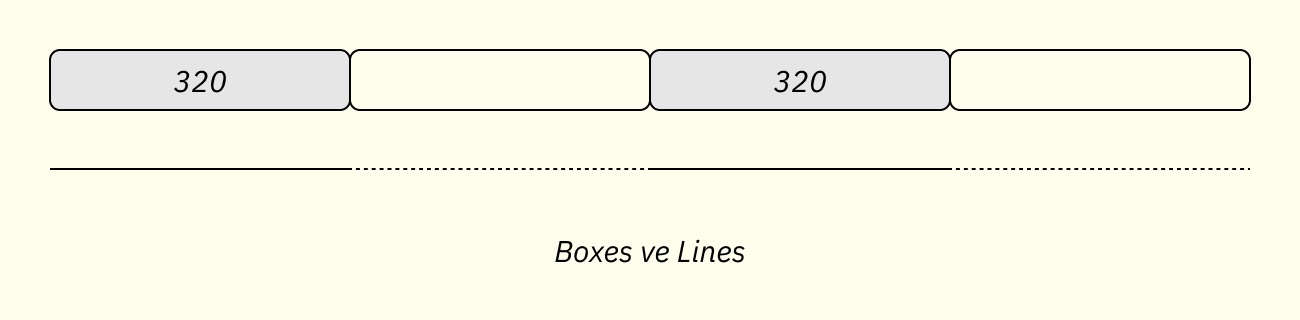
Boxes placed next to each other, representing the full and emptied data. And line graph has displayed below.
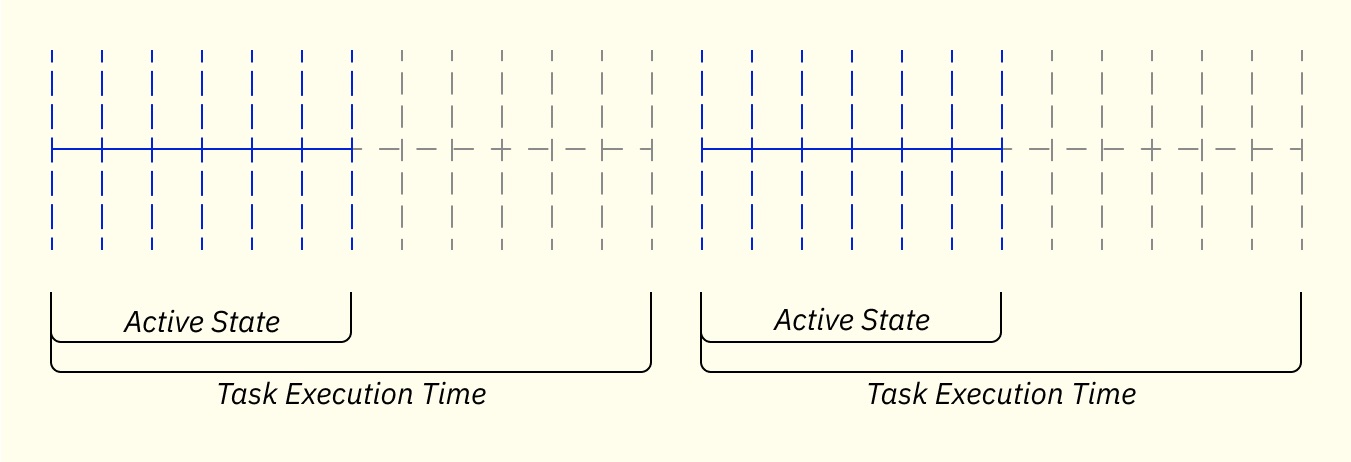
We’re grouping the lines or the whole task period. Generally, we draw continuous lines for task’s active status, and dotted lines for passive state. Then we’re drawing vertical lines, to display each entrance to the task. In a bare-metal or in RTOS systems, tasks are designed to be entered periodically like 1-4-20 milliseconds interval or more.

And we’re putting dots to represent variables / state indicators into the vertical lines. If the variable of the task is considered with the previous value, we’re purring a longer arrow. In the example above, Variable A is compared each time with the initial value of A. Variable G is compared with just previous value from previous execution of the task. When variable G is changed we’re resetting the value of A. And following variable A comparisons will be done with the reinitialized value.