There is a high-resolution pdf is available; Download
Dropbox might not be able to provide a preview because of the size. You can download the pdf from the link.
A. Description
The infographic is based on a satellite view of Turkey, Balkans and southern Ukranian territory. There is a gradient placed on top of the image, goes from white-top to transparent-bottom.
Infographics contains some tables and other visualizations. I’ll provide the content under the titles below. Some of the text contain decorative icons.
A.1. Section: Taking a Bus Trip (Top-Left)
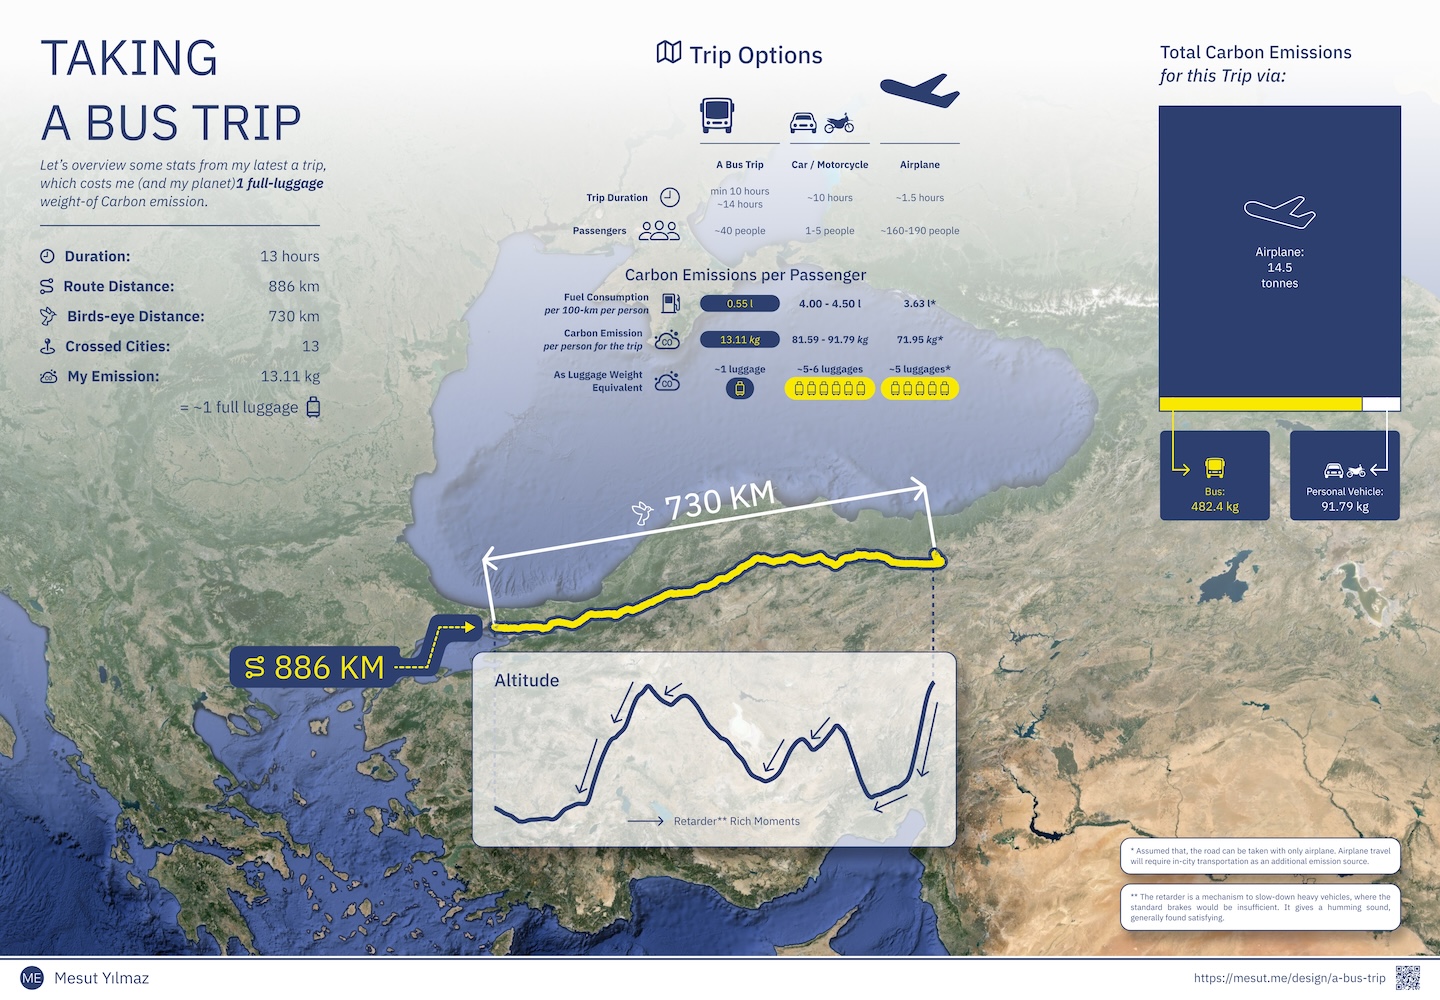
Let’s overview some stats from my latest a trip, which costs me (and my planet)1 full-luggage weight-of Carbon emission.
- Duration: 13 hours
- Route Distance: 886 km
- Birds-eye Distance: 730 km
- Crossed Cities: 13
- My Emission: 13.11 kg = ~1 full luggage
A.2. Table: Trip Options (Top-Middle)
| A Bus Trip | Car / Motorcycle | Airplane | |
|---|---|---|---|
| Trip Duration | 10-14 hours | ~10 hours | ~1.5 hours |
| Passengers | ~40 people | 1-5 people | ~160-190 people |
| Carbon Emissions per Passenger | |||
| Fuel Consumption | per 100-km per person | 0.55 l | 4.00 - 4.50 l |
| Carbon Emission per person for the trip | 13.11 kg | 81.59 - 91.79 kg | 71.95 kg |
| As Luggage Weight Equivalent | ~1 luggage | ~5-6 luggages | ~5 luggages |
A.3. Visualization: Total Carbon Emissions for this Trip via: (Top-Right)
This visualization simply display boxes according to the emission size. The biggest one is airplane emission. Others has the smaller, and proportional to their values sizes. The 3 box also forms a full rectangle.
- Airplane: 14.5 tonnes
- Bus: 482.4 kg
- Personal Vehicle: 91.79 kg
A.4. Visual: Path Taken (Middle-Center)
There is a visible path for the route-taken. There are 2 marks; a bird-eye-distance 730 km and path lenght 886 km.
The path is starting from right and ends at the left side.
A.5. Graph: Altitude (Bottom-Center)
This graph show an altitude graph mathed with the route. Roughly there are 7 different type of slope is visible.
From right to left:
- A hard-decrease
- A mild-decrease
- A rise
- 2 steps of mild decrease
- A rise
- 3 steps of hard-decrease
- A flat line
All of the decreasing lines has marked with an arrow, named as retarder-rich moments. See the Notes title below.
A.6. Notes (Bottom-Right)
Assumed that, the road can be taken with only airplane. Airplane travel will require in-city transportation as an additional emission source.
The retarder is a mechanism to slow-down heavy vehicles, where the standard brakes would be insufficient. It gives a humming sound, generally found satisfying.
A.7. Footer (End-Bottom)
At the left side: my website’s icon and My name is placed.
At the right side: the blog post link and a qr code is placed.
B. Process
B.1. Data Collection
- Note-taking during trip
- Open Street Maps for fetching route info
- Plan a Route for elevation data (The next time, I’ll log accelerometer data with my phone.)
B.2. Preparations
- I wrote a script to merge polyline data, convert into GPS points, map these points into an SVG path to be able to work on Figma with this path.
The script is available as a Github Gist
My script has a limitation, GPS points are not meant to be placed on a 2d dimensional plane. So when the GPS points are projected on 2D plane, it would appear as warped in a degree. If the path is long (or if the path is near to the arctic area), the warp would be more visible. This is just a quick script produces good enough results for a mid-range paths.
-
Google Earth (Pro) is excellent at fetching high quality geographic images.
-
A Google Sheet page is an awesome place to gather all the information and cross-check the partial information.
-
I benefitted from ChatGPT for estimating some data, like an airplane’s fuel consumption and emission.
B.3. Gathering
Figma is my favorite tool, its versatile and agile working catches me. And Auto-layout is my favorite, which dramatically reduces the time spent on alignment.